Financial Information
- Financial Summary
- Statement of Financial Position
- Income Statement
Management Information
| Establishment | July 2, 2014 |
|---|---|
| Listing Date | August 8, 2014 |
| Capital | 135 (KRW 100M) |
| End of Settlement | 31. December |
| Total Assets | 29,538 (Consolidated Basis, Unit: KRW 100M) |
Summary Information
- Consolidated Basis, Unit: KRW 100 M
| Category | FY2023 | FY2024 | FY2025 | |
|---|---|---|---|---|
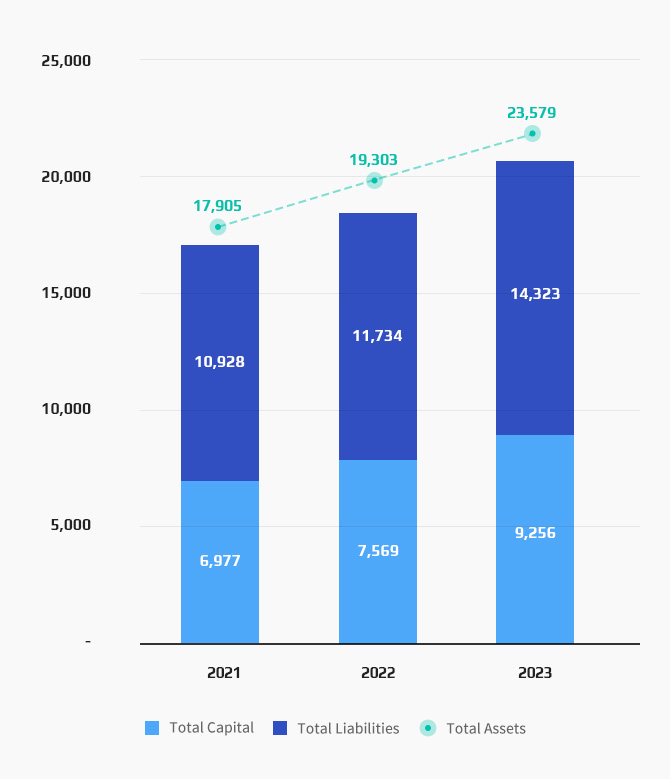
| Financial Status | Total Assets | 23,579 | 29,538 | 32,050 |
| Total Liabilities | 14,323 | 17,923 | 19,722 | |
| Total Capital | 9,256 | 11,615 | 12,328 | |
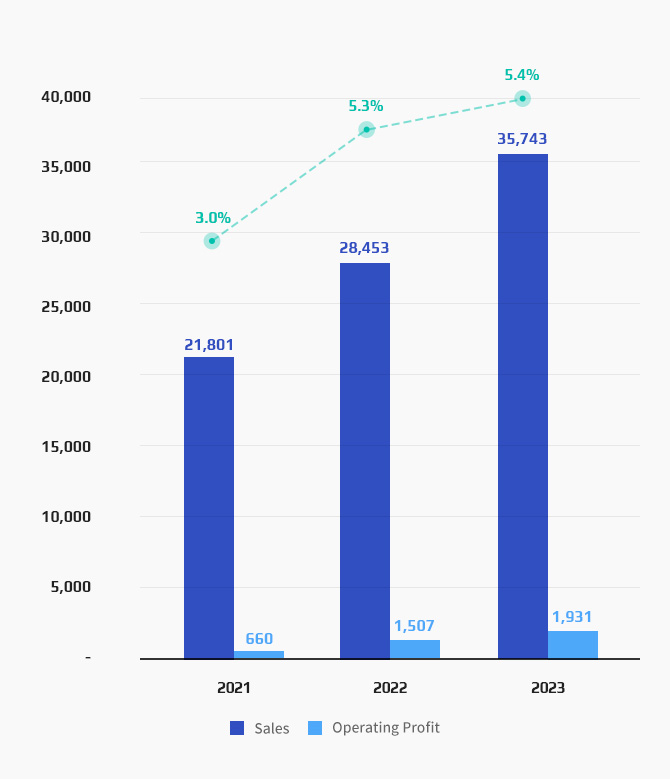
| Profit and Loss Status | Sales | 35,743 | 40,415 | 45,053 |
| Operating Profit | 1,931 | 1,544 | 1,618 | |
| Operating Profit Ratio | 5.4% | 3.8% | 3.6% | |
Financial Status
- Consolidated Basis, Unit: KRW 100 M
Profit and Loss Status
- Consolidated Basis, Unit: KRW 100 M
Consolidated Basis
(Unit: KRW M)
| Category | 2023 (10th Term) | 2024 (11th Term) | 2025 (12th Term) | |
|---|---|---|---|---|
| Assets | Current Assets | 1,008,713 | 1,184,825 | 1,337,559 |
| Non-current Assets Held for Sale | 26,506 | 18,283 | 18,639 | |
| Non-current Assets | 1,322,632 | 1,750,734 | 1,848,843 | |
| Total | 2,357,851 | 2,953,842 | 3,205,041 | |
| Liabilities | Current Liabilities | 1,118,745 | 1,402,244 | 1,518,070 |
| Non-current Liabilities Held for Sale | 16,334 | 9,078 | 9 | |
| Non-current Liabilities | 297,187 | 297,187 | 454,102 | |
| Total | 1,432,266 | 1,792,341 | 1,972,181 | |
| Capital | Capital | 13,514 | 13,514 | 13,514 |
| Capital Surplus | 445,800 | 445,893 | 445,910 | |
| Other Capital Components | (152) | (152) | -152 | |
| Accumulated Other Comprehensive Income | 62,793 | 145,561 | 162,998 | |
| Profit Surplus | 359,678 | 494,959 | 549,114 | |
| Non-controlling Interest | 43,952 | 61,726 | 61,476 | |
| Total | 925,585 | 1,161,501 | 1,232,860 | |
| Liability Ratio | 156.6% | 155% | 160% | |
- ※ Korean International Financial Reporting Standards (K-IFRS).
- ※ Please refer to business reports in “Disclosure Information – Electric Disclosure” or “Disclosure Information – Announcements.
Separate Basis
(Unit: KRW M)
| Category | 2023 (10th Term) | 2024 (11th Term) | 2025 (12th Term) | |
|---|---|---|---|---|
| Assets | Current Assets | 546,181 | 758,055 | 591,079 |
| Non-current Assets | 913,541 | 1,089,328 | 1,224,214 | |
| Total | 1,459,722 | 1,847,383 | 1,815,293 | |
| Liabilities | Current Liabilities | 517,778 | 684,437 | 649,630 |
| Non-current Liabilities | 68,866 | 68,618 | 42,148 | |
| Total | 586,644 | 753,055 | 691,778 | |
| Capital | Capital | 13,514 | 13,514 | 13,514 |
| Capital Surplus | 462,539 | 462,539 | 462,539 | |
| Other Capital Components | (152) | (152) | -152 | |
| Accumulated Other Comprehensive Income | 68,832 | 150,915 | 167,622 | |
| Profit Surplus | 328,345 | 467,512 | 479,992 | |
| Total | 873,078 | 1,094,328 | 1,123,515 | |
| Liability Ratio | 68.2% | 69.4% | 62% | |
- ※ Korean International Financial Reporting Standards (K-IFRS)
- ※ Please refer to business reports in “Disclosure Information – Electric Disclosure” or “Disclosure Information – Announcements.”
Consolidated Basis
(Unit: KRW M)
| Category | 2023 (10th Term) | 2024 (11th Term) | 2025 (12th Term) |
|---|---|---|---|
| Sales | 3,574,266 | 4,041,529 | 4,505,250 |
| Cost of Sales | 3,028,542 | 3,410,198 | 3,858,056 |
| Gross Profit | 545,724 | 631,331 | 647,194 |
| Sales and Administrative Expenses | 352,614 | 476,927 | 485,394 |
| Operating Profit (Loss) | 193,110 | 154,404 | 161,800 |
| Non-operating Income | 58,946 | 104,844 | 46,829 |
| Non-operating Expenses | 57,059 | 57,020 | 111,364 |
| Net Profit (Loss) before Corporate Tax | 194,997 | 202,228 | 97,265 |
| Corporate Tax Expenses | 30,957 | 47,911 | 36,165 |
| Net Profit (Loss) During the Term | 164,040 | 154,317 | 61,100 |
| Operating Profit Ratio | 5.4% | 3.8% | 3.6% |
- ※ Korean International Financial Reporting Standards (K-IFRS)
- ※ Please refer to business reports in “Disclosure Information – Electric Disclosure” or “Disclosure Information – Announcements.”
Separate Basis
(Unit: KRW M)
| Category | 2023 (10th Term) | 2024 (11th Term) | 2025 (12th Term) |
|---|---|---|---|
| Sales | 1,590,509 | 1,797,017 | 1,925,420 |
| Cost of Sales | 1,319,205 | 1,517,343 | 1,580,045 |
| Gross Profit | 271,303 | 279,674 | 345,375 |
| Sales and Administrative Expenses | 137,739 | 166,871 | 222,019 |
| Operating Profit (Loss) | 133,565 | 112,803 | 123,356 |
| Non-operating Income | 84,971 | 140,959 | 72,780 |
| Non-operating Expenses | 50,458 | 66,818 | 150,823 |
| Net Profit (Loss) before Corporate Tax | 168,078 | 186,944 | 45,313 |
| Corporate Tax Expenses | 13,623 | 36,541 | 27,743 |
| Net Profit (Loss) During the Term | 154,455 | 150,403 | 17,570 |
| Operating Profit Ratio | 8.4% | 6.3% | 6.4% |
- ※ Korean International Financial Reporting Standards (K-IFRS)
- ※ Please refer to business reports in “Disclosure Information – Electric Disclosure” or “Disclosure Information – Announcements.”